


- WooCommerce analytics dashboard with orders analytics, product analytics, customer analytics, marketing insights, and finance reporting.
- Charts and KPIs for net sales, gross sales, discounts, refunds, coupon usage, average order value, repeat customers, returning orders, and revenue trends.
- Heatmaps, distributions, comparisons, top lists, segments (RFM), churn risk scoring, and actionable insights.
- Accountant-ready CSV export for daily financial reconciliation (gross, net, discounts, refunds, tax, shipping, orders).
WooCharty Smart Analytics & Insights for WooCommerce Stores
WooCharty is a modern smart and deep WooCommerce analytics dashboard plugin that turns store data into actionable insights. Track orders, marketing performance, products, customers, and finance health with clean charts, averages, KPIs, and automated observations. Built for store owners, marketers, and teams who need fast answers without complex BI tools.
Deep insights for everything for your
woocommerce store
WooCommerce Orders Analytics
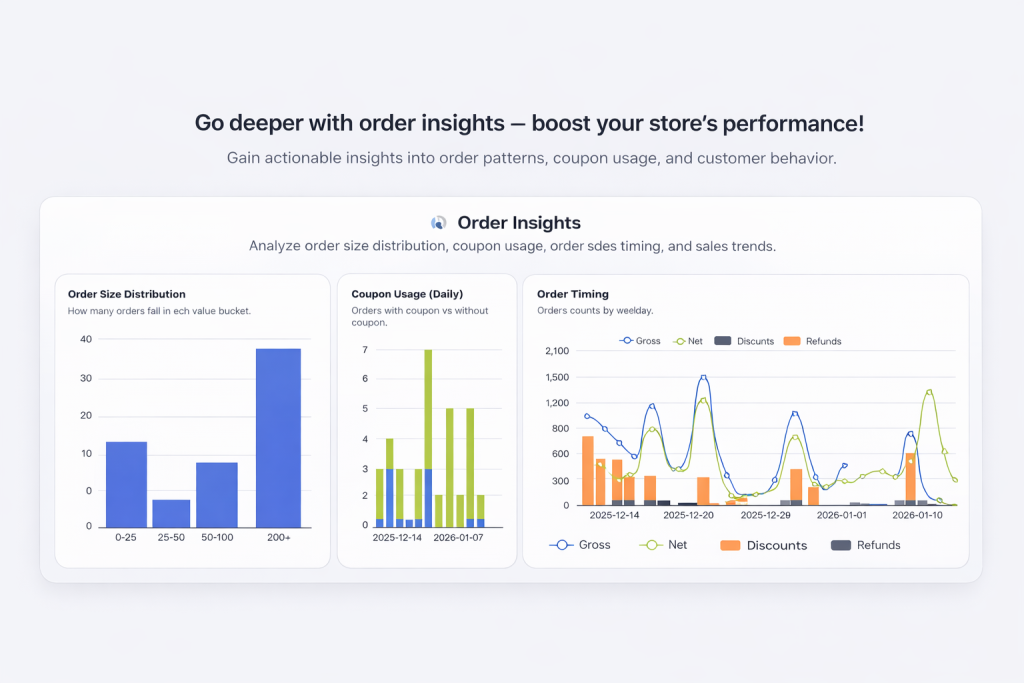
WooCharty provides powerful order-level analytics that help you understand how customers buy, when they buy, and how revenue quality changes over time.
Features
-
Order Size Distribution
Analyze orders grouped into value ranges (0–25, 25–50, 50–100, 100–200, 200+) to instantly understand basket size and order quality.
-
Coupon Usage (Daily)
Track orders placed with and without coupons over time to measure discount dependency and promotion effectiveness.
-
Orders by Hour
View order volume by hour of day (store timezone) to identify peak buying hours and optimize campaign timing.
-
Orders by Weekday
Discover best-performing days by analyzing order counts across weekdays.
-
Net vs Gross Sales Trend
Visualize net sales, gross sales, discounts, and refunds in a single trend view for a clear revenue breakdown.
Woocmommerce Marketing Insights and Reports
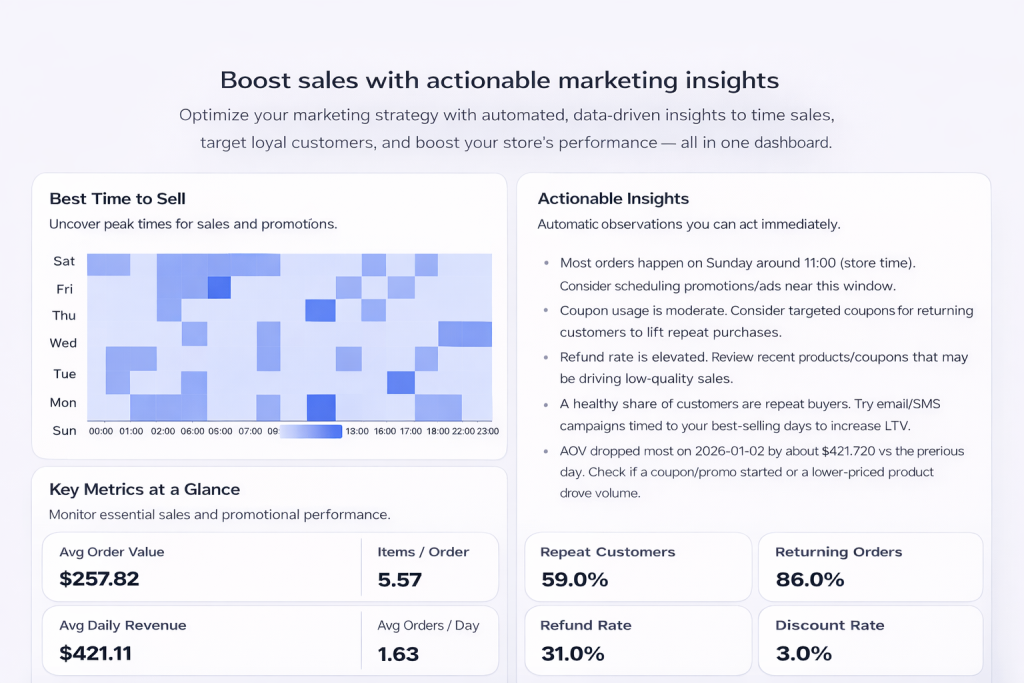
WooCharty delivers clear KPI averages and marketing signals designed to support smarter campaign decisions and continuous store optimization.
Features
-
KPI Averages
Monitor essential store averages including Average Order Value (AOV), Items per Order, Average Daily Revenue, and Average Orders per Day.
-
Loyalty & Retention Signals
Track Repeat Customers percentage and Returning Orders percentage to measure customer loyalty and long-term store health.
-
Quality Indicators
Analyze Refund Rate, Discount Rate, and Coupon Orders percentage to identify low-quality sales and pricing pressure.
-
Best Time to Sell Heatmap
Visual heatmap showing order activity by weekday and hour (store timezone), helping you schedule ads and promotions at peak times.
-
Actionable Insights
Automatic observations generated from the selected date range, highlighting timing patterns, coupon reliance, refund pressure, repeat-buyer health, and AOV trend changes.
Products Analytics
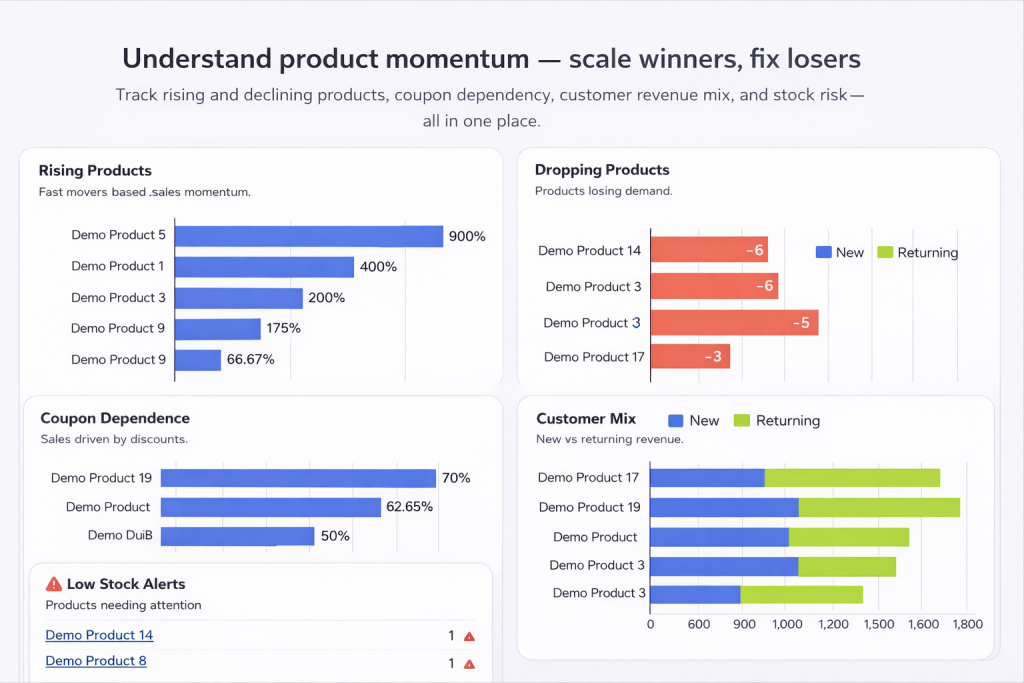
WooCharty gives you deep visibility into product performance, momentum, discount dependency, and inventory risk so you can act before revenue is affected.
Features
Rising Products
Identify fast-moving products based on changes in units sold and sales momentum.
Dropping Products
Detect products losing momentum early by tracking declines in units sold.
Coupon Dependence
Highlight products most frequently sold with coupons to uncover discount-driven demand and pricing risk.
New vs Returning Revenue (Top Products)
Analyze revenue split between new and returning customers for your best-performing products.
Category Performance
View sales distribution by product category for a clear overview of category-level performance.
Low Stock Alerts
Automatically flag products with low inventory levels (requires stock management enabled) to prevent lost sales.
Customer Insights & Retention
WooCharty helps you understand who your customers are, how they behave, and which ones need attention—so you can grow loyalty and reduce churn.
Features
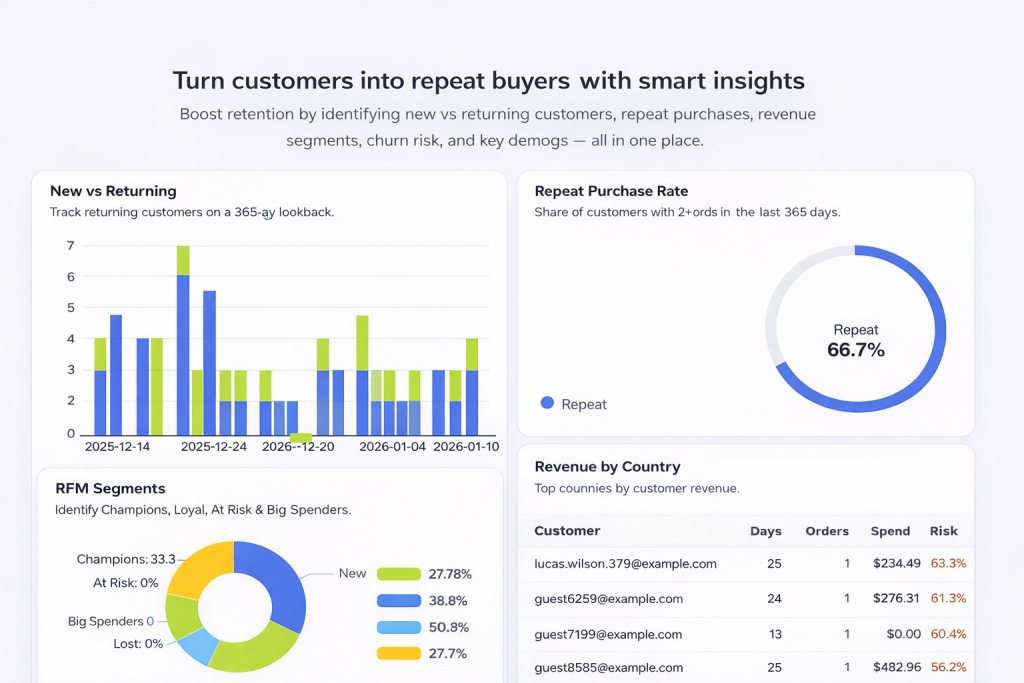
New vs Returning Customers
Customers are classified using a 365-day lookback, with activity visualized over time to track retention trends.
Repeat Purchase Rate
Measure the percentage of customers with two or more orders as a clear retention indicator.
RFM Segmentation
Segment customers by Recency, Frequency, and Monetary value into groups such as Champions, Loyal, Big Spenders, At Risk, Lost, and New.
Revenue by Country
View top countries ranked by net revenue for the selected date range.
Spend vs Orders (Top Customers)
Analyze the relationship between total spend and number of orders to identify your most valuable customers.
Churn Risk (Top 20)
Automatic customer risk scoring based on recency, frequency, and spending behavior to support reactivation campaigns.
Finance Reporting & Risk Analysis
WooCharty’s Finance module is purpose-built for financial clarity. It avoids duplicating marketing charts and instead focuses on revenue stability, leakage, and dependency risk.
Features
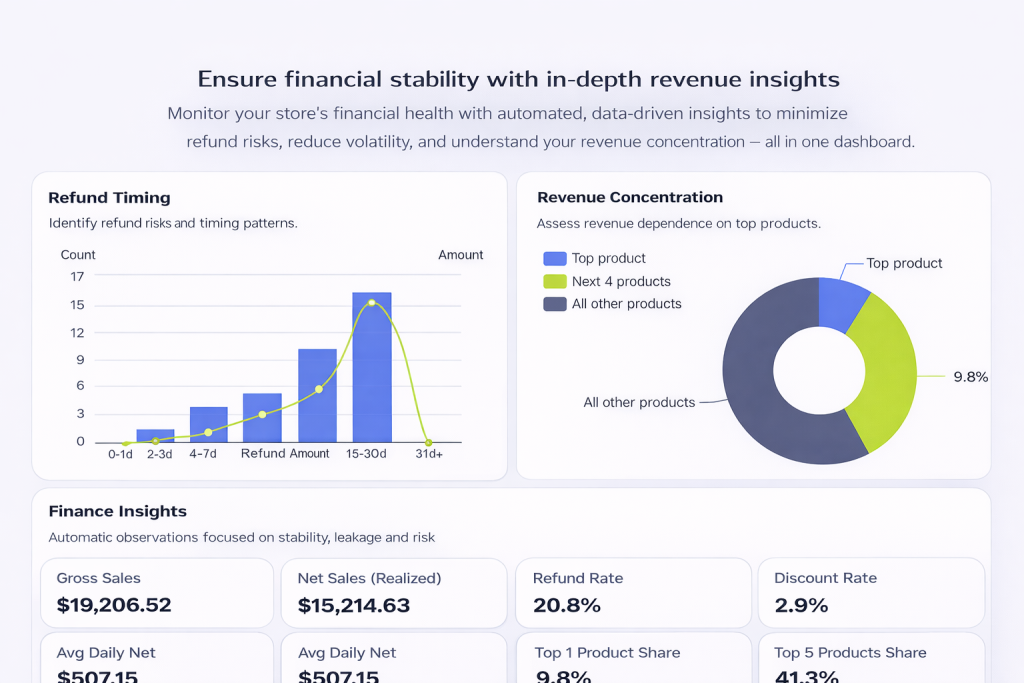
Finance Snapshot KPIs
Track core financial metrics including Gross Sales, Net Sales (realized), Average Daily Net Revenue, Refund Rate, and Discount Rate.
Revenue Stability Indicator
Measure day-to-day revenue consistency using Net Volatility to identify unstable income patterns.
Revenue Concentration KPIs
Monitor Top 1 Product Share and Top 5 Products Share to assess dependency risk on a small number of products.
Refund Timing Analysis
View how quickly refunds occur after purchase to detect operational and policy-related risk.
Revenue Concentration Chart
Visual breakdown of revenue contribution from the top product, next top products, and all remaining products highlighting diversification strength.
Finance Insights
Automatic observations focused on volatility, discount pressure, refund liability, and concentration risk within the selected range.
Accountant-Ready CSV Export
Export daily financial data for reconciliation, including gross sales, net sales, discounts, refunds, taxes, shipping, and order counts.
What's Next?
- We will send you a brief email confirming that we have successfully received your request and begun working on it.
- Our solution advisor will review your requirements and get back to you within 2 business days.
- If needed, we may sign a mutual NDA within 1-2 business days to guarantee the utmost confidentiality.
- Within 3-5 days, our business development manager will provide an initial project estimate, rough figures, or project recommendations.
Related Searches
Explore more topics